Loading...
Loading...
Loading...
A product byMUHILAN and Team❤️.
Powerful data visualization components including interactive charts, stats, and dashboard widgets designed to turn complex data into actionable insights.
A premium SVG line and area chart featuring dynamic path-drawing animations entirely powered by Framer Motion. Uses an interactive hover grid for rich tooltips.

Activate Live Preview
A structurally pure SVG donut chart showing traffic acquisition. Computes strokes dynamically and features an active legend targeting specific data slices.

Activate Live Preview
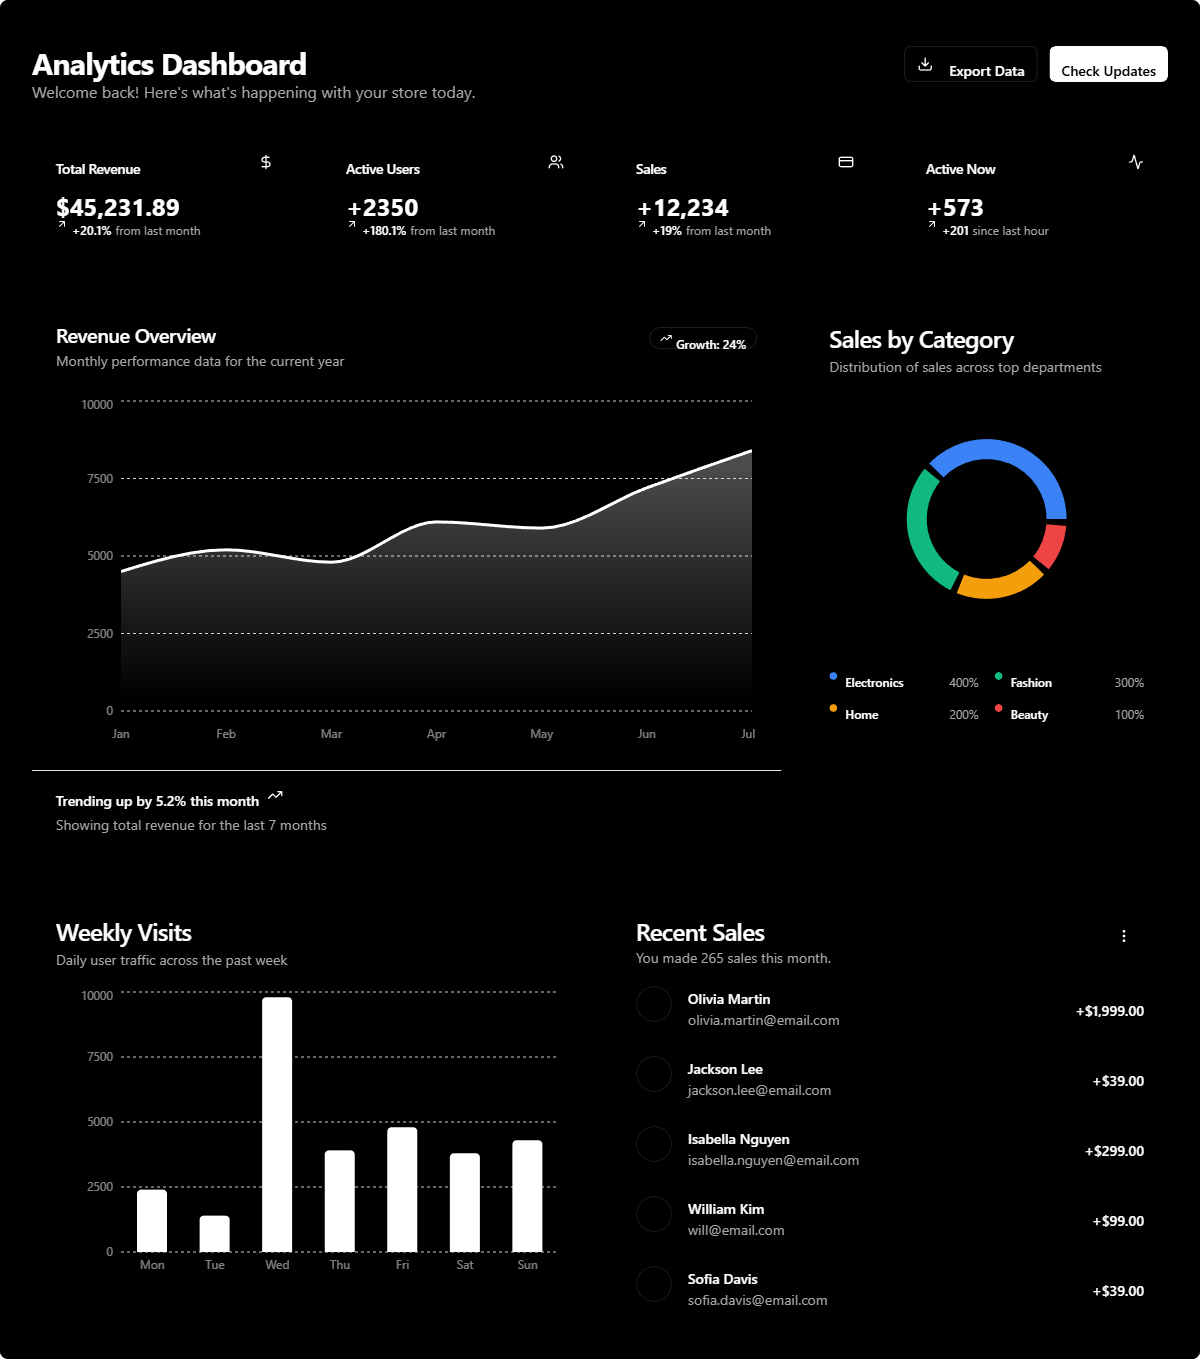
A production-ready React admin dashboard template featuring interactive Recharts data visualization. Includes statistical trend cards, revenue metrics, and a modern glassmorphism UI design. Fully responsive and accessible.
Activate Live Preview
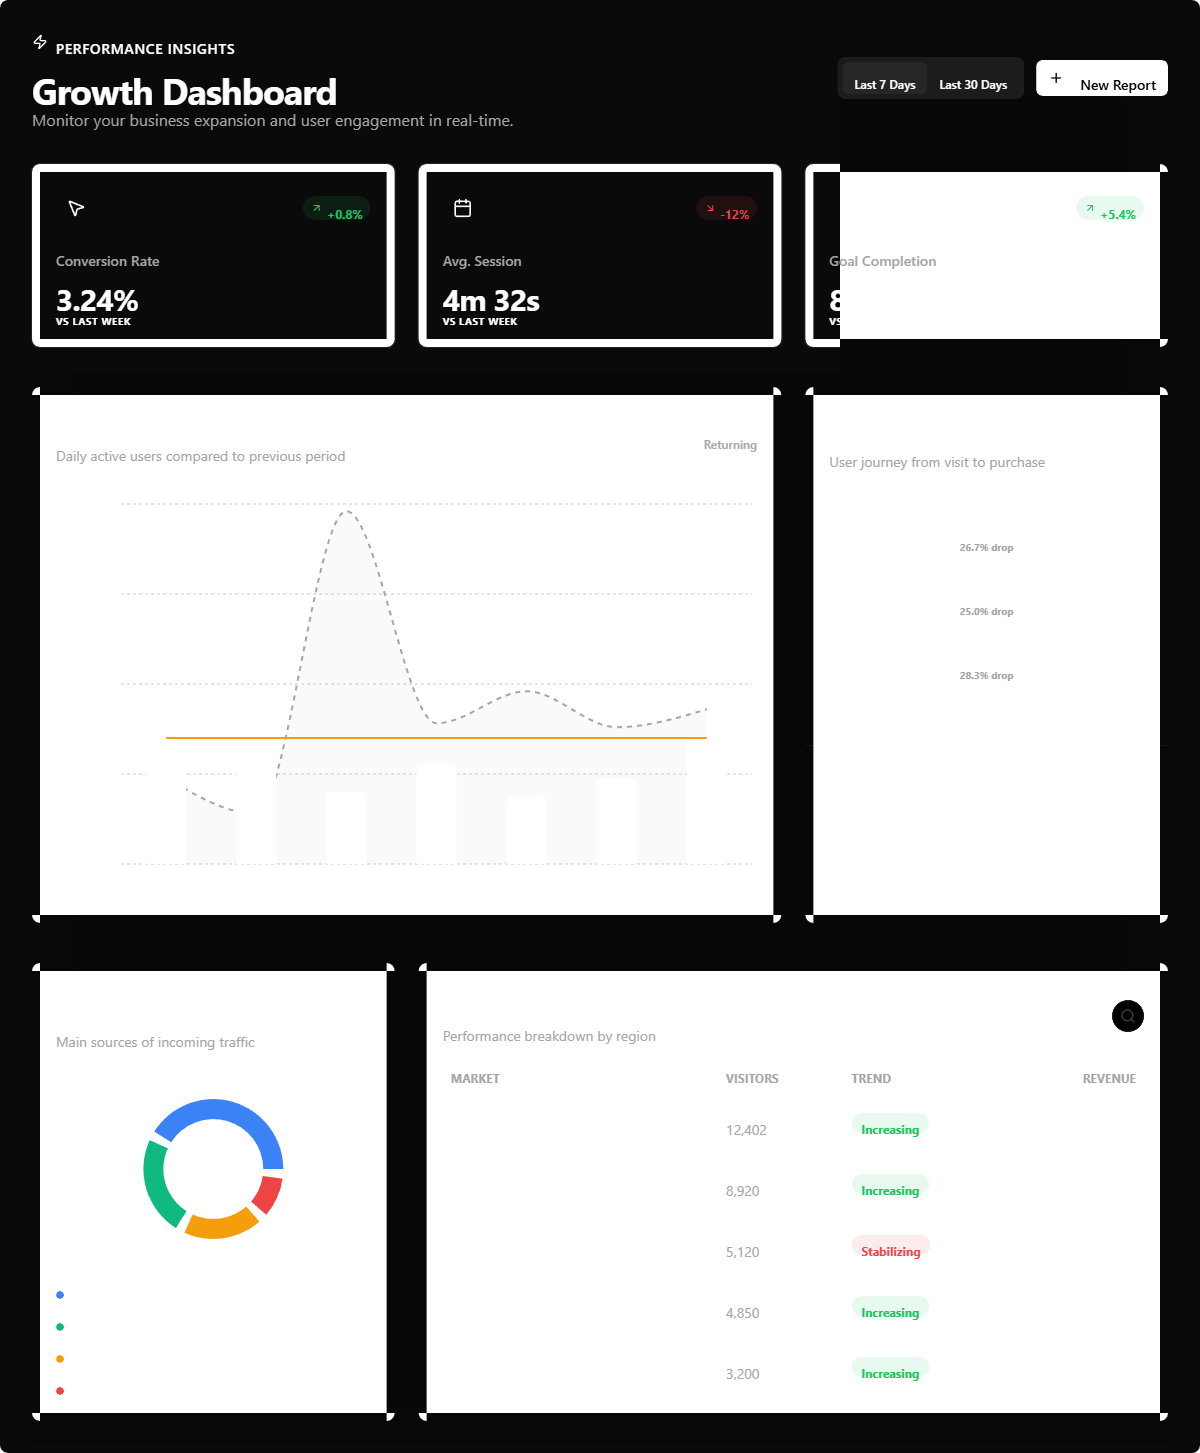
A professional SaaS analytics dashboard designed for growth tracking. Visualizes conversion funnels, user demographics, and key performance indicators (KPIs) with a premium, clean aesthetic.
Activate Live Preview
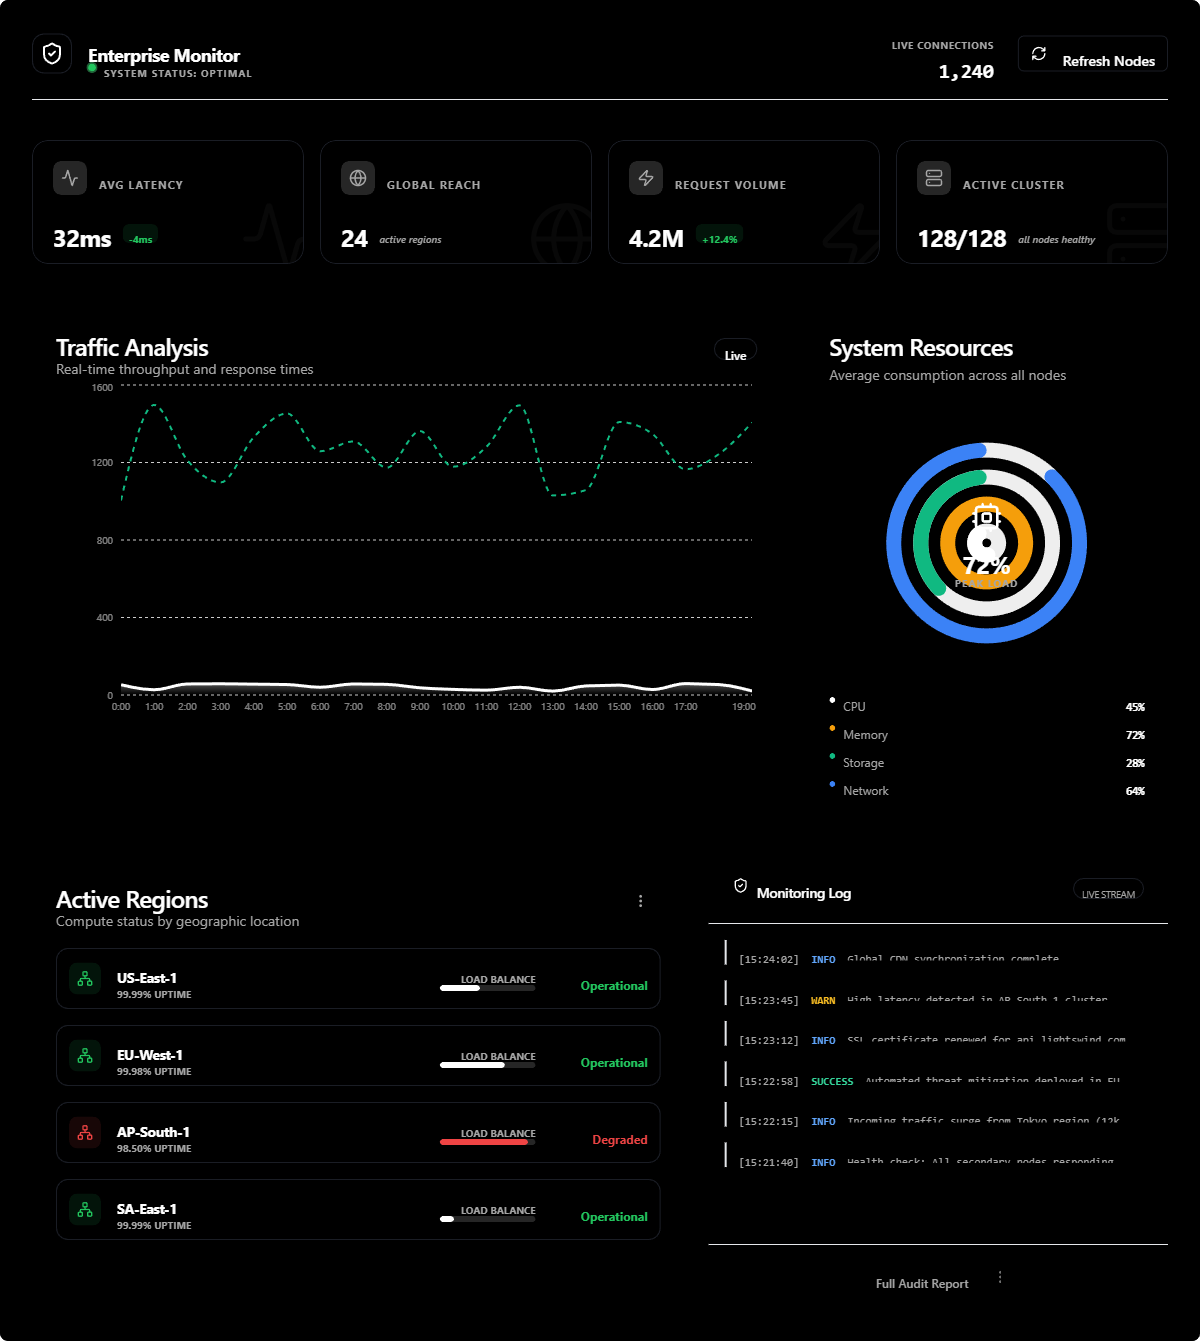
Real-time enterprise infrastructure monitoring dashboard. Features global heatmaps, server health status, and network latency graphs. Built for high-scale applications requiring instant data feedback.
Activate Live Preview
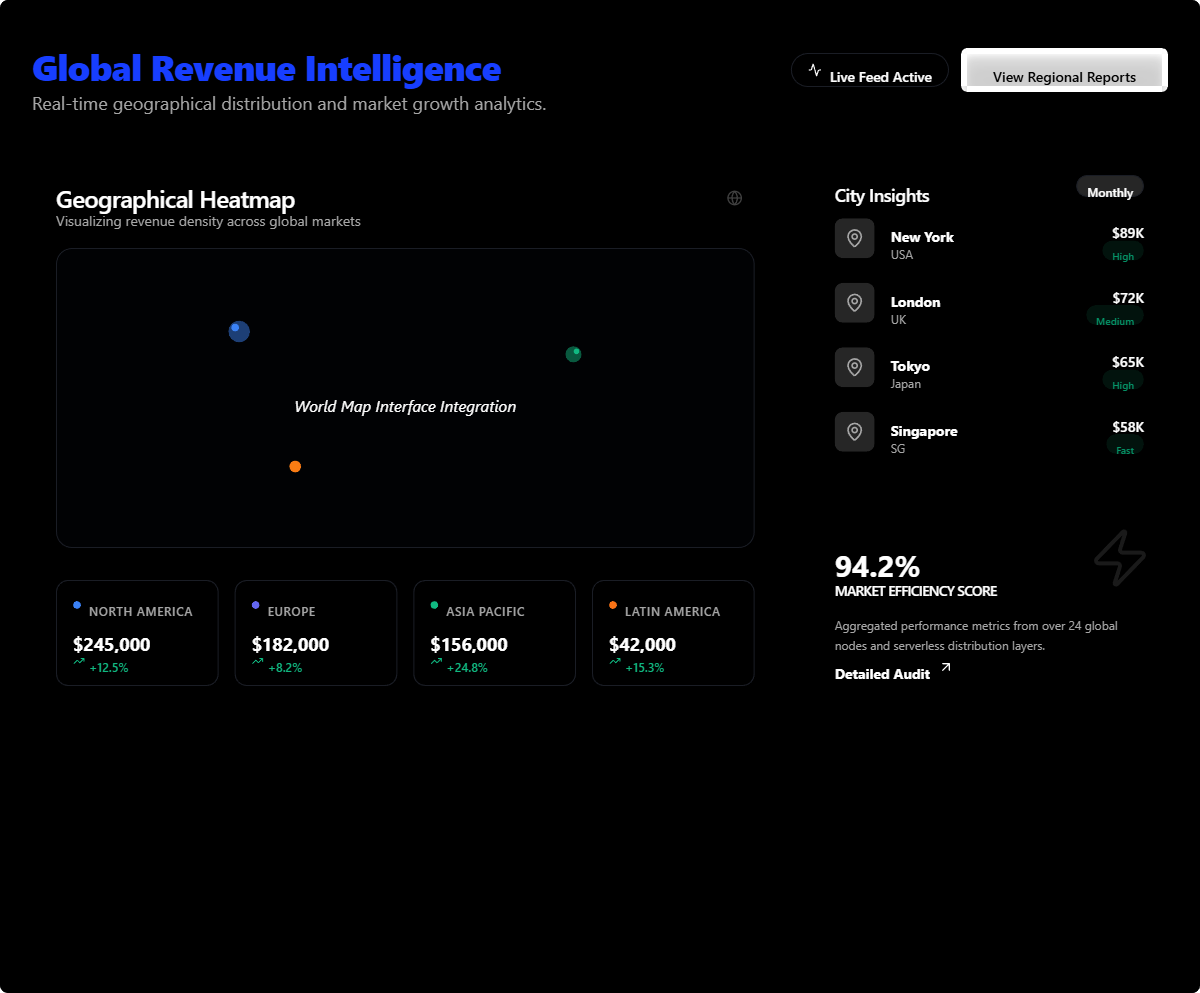
An interactive geographical heatmap for tracking real-time global revenue distribution. Features localized data drill-downs and animated growth indicators for high-level business intelligence.
Activate Live Preview
Premium real-time computational monitoring and sandbox calculator dashboard for multi-model LLM inference gateways.
Activate Live Preview
A professional 'Neural Analytics' dashboard designed for deep-tech SaaS. Features high-fidelity Area Charts, animated resource load progress manifest, and a protocol-inspired micro-stat grid.
Activate Live Preview
A high-fidelity conversion and traffic analytics dashboard. Features a sophisticated funnel visualization, vertical traffic source bars, and status-aware infrastructure headers.
Activate Live Preview